
An independent Commission has found Manchester City guilty of all charges related to serious breaches of the Premier League's financial rules over nine seasons between 2009/10 and 2017/18. The Premier League published its core findings on 29 September 2026.
Manchester City has since appealed the decision. The Premier League confirmed the appeal on 2 October, while any sanction remains a separate part of the disciplinary process.
That leaves an obvious football question: what would those nine Premier League seasons have looked like if Manchester City had not been there at all?
Simply deleting City from the final league table is not enough. Every other club played them twice, and those matches produced points, goals and goal difference that helped shape the table. Some clubs took six points from City in a season. Others lost both. If City disappear, those results have to disappear too.
So we rebuilt all nine league tables from scratch.
Across the period, Manchester City played 342 Premier League matches. We removed every one of them, leaving the other 19 clubs with 36 matches each, then recalculated the tables using points, goal difference and goals scored.
The obvious headline is that all three titles City won during the period change hands. Manchester United gain two and Liverpool gain one. But the more interesting changes sit underneath that headline. The 2011/12 title race goes from goal difference to a 20-point win, the 2017/18 season becomes a one-point race, and Blackpool escape the bottom three in 2010/11 while Wolves fall into it.
Key finding: Removing Manchester City and every league match they played changes the named champion in three of the nine seasons. It also changes the identity of the bottom three once, but never causes an additional top-four membership change beyond City's own removal.
Explore the latest Premier League table, team stats and trends →
How We Rebuilt the Premier League Without Manchester City
The experiment covers every Premier League season from 2009/10 to 2017/18. For each year, we created three versions of the table so we could separate the obvious effects from the genuinely interesting ones.
The first is simply the real historical table. The second removes Manchester City from the standings but leaves everyone else's results untouched. That shows the automatic movement caused by deleting one club. If City finished third, for example, the teams below them all move up one place.
The third table is the real counterfactual. Manchester City disappear, but so do all of their matches. Every point, goal scored and goal conceded from those fixtures is removed, and the other 19 clubs are ranked again after 36 matches.
That distinction matters because the two versions can tell very different stories. A club moving from fifth to fourth because City no longer occupy a place above them is mechanical. A club moving from eighth to 12th because three points earned against City have vanished is a genuine consequence of removing the fixtures.
This is deliberately a narrow experiment. It is not a model of any sanction the Premier League may impose, and it does not claim that history would really have unfolded this way if Manchester City had not participated.
Nine Seasons Without Manchester City
The broad picture is surprisingly clear.
| Season | Actual champion | Champion without Man City | No-City title margin |
|---|---|---|---|
| 2009/10 | Chelsea | Chelsea | 7 pts |
| 2010/11 | Man United | Man United | 8 pts |
| 2011/12 | Man City | Man United | 20 pts |
| 2012/13 | Man United | Man United | 12 pts |
| 2013/14 | Man City | Liverpool | 3 pts |
| 2014/15 | Chelsea | Chelsea | 14 pts |
| 2015/16 | Leicester | Leicester | 10 pts |
| 2016/17 | Chelsea | Chelsea | 5 pts |
| 2017/18 | Man City | Man United | 1 pt |
All three City title seasons produce a different champion, but the reconstructed races are nothing alike. One becomes a landslide, one remains close, and one tightens dramatically.
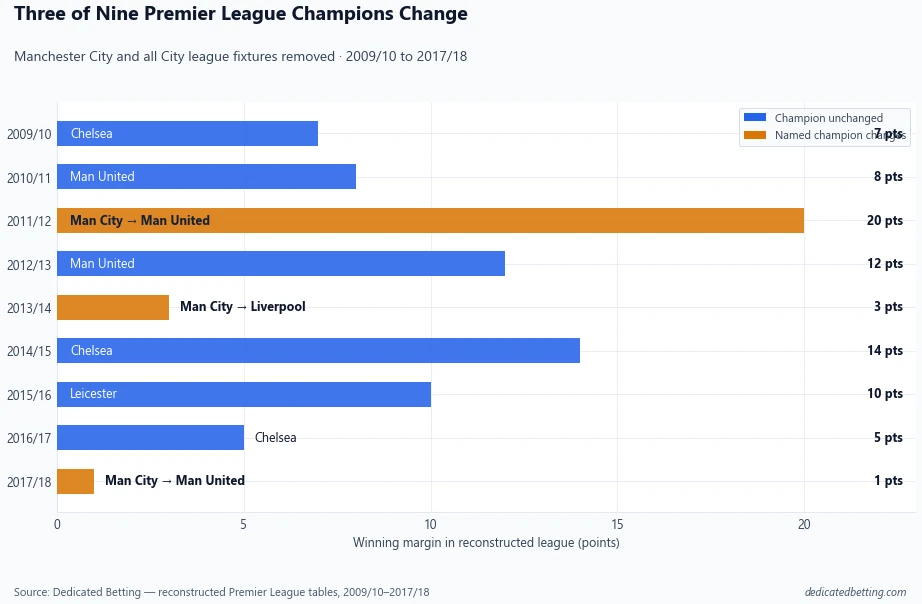
The three changed seasons show why this exercise is more interesting than simply awarding City's finishing position to the club below them.
2011/12: From Goal Difference to a 20-Point Manchester United Title
Few Premier League seasons are remembered more vividly than 2011/12. Manchester City and Manchester United both finished on 89 points, with City taking the title on goal difference after Sergio Agüero's stoppage-time winner against QPR.
In our reconstructed league, that famous finish disappears completely.
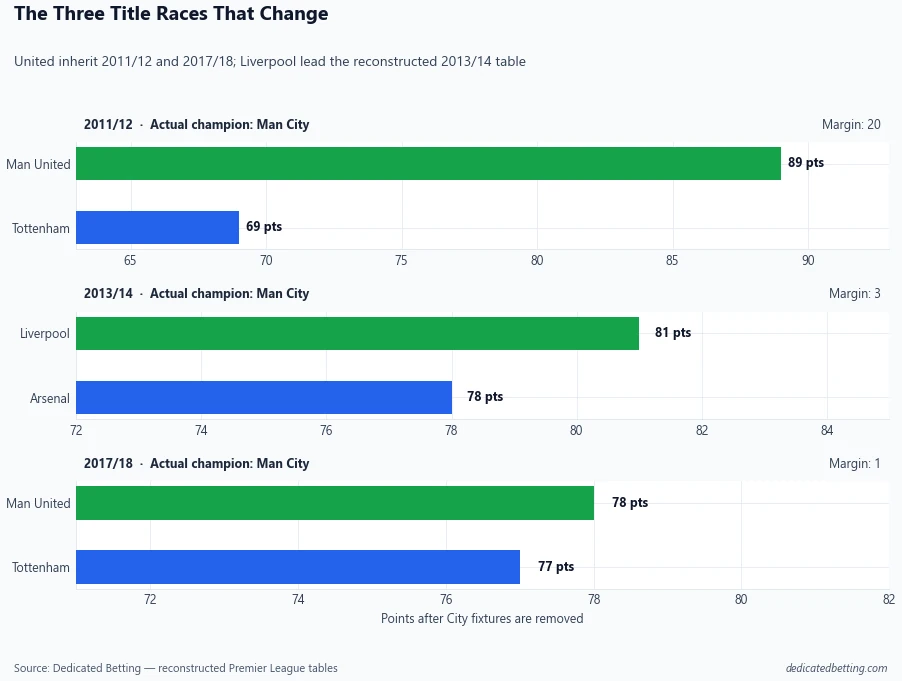
United remain on 89 points because they took nothing from either Manchester derby that season. City beat them twice, including the famous 6-1 victory at Old Trafford, so removing those fixtures does not cost United a single point. Tottenham, meanwhile, become the nearest challengers on 69.
What was one of the closest title races in Premier League history therefore becomes a 20-point Manchester United win.
The real 2011/12 season ended level on 89 points. Without Manchester City or their matches, Manchester United remain on 89 and finish 20 points above Tottenham.
The season is also a good illustration of the central quirk in the whole experiment. Removing City does not simply promote the club that finished below them. It also changes the value of every other team's record against City. United's two defeats suddenly cost them nothing, while clubs that did take points from City lose those points from the reconstructed table.
2013/14: Liverpool Finish Three Points Clear
The 2013/14 season produces a different type of title change.
Manchester City actually finished on 86 points, two ahead of Liverpool and four ahead of Chelsea. Once City and their fixtures are removed, Liverpool take first place on 81 points, but the order underneath them changes as well.
| Position | Team | Points |
|---|---|---|
| 1 | Liverpool | 81 |
| 2 | Arsenal | 78 |
| 3 | Chelsea | 76 |
| 4 | Everton | 72 |
Liverpool win the reconstructed league by three points, with Arsenal rather than Chelsea finishing second.
That reshuffle comes from the clubs' very different results against City. Chelsea had taken six points from them during the season, while Arsenal managed only one. Deleting the City fixtures therefore removes five more points from Chelsea than Arsenal, enough to reverse their order in the table.
This was also a season in which City's attacking strength was obvious. They beat Norwich 7-0 and Tottenham 6-0, yet those heavy wins sit alongside results such as Chelsea's two victories over City. The counterfactual rewards and punishes clubs according to that variation, which is why the table changes in ways that are not obvious from the final standings alone.
2017/18: City's 100-Point Season Becomes a One-Point Race
If 2011/12 becomes far less dramatic without City, 2017/18 moves in the opposite direction.
City's real season was one of overwhelming dominance. They became the first Premier League club to reach 100 points, finishing 19 clear of Manchester United, with Tottenham another four points further back.
The real top three were:
| Position | Team | Points |
|---|---|---|
| 1 | Man City | 100 |
| 2 | Man United | 81 |
| 3 | Tottenham | 77 |
Simply deleting City's row would hand the title to United with a four-point advantage over Spurs. Once the City fixtures are removed as well, that gap almost disappears.
United lose the three points they earned from their 3-2 win at the Etihad, while Tottenham lose nothing because they failed to take a point from City. The reconstructed table therefore leaves United on 78 and Tottenham on 77.
A real 19-point Manchester City title becomes a one-point Manchester United title.
The irony is that one of United's most memorable results of the season works against them in this experiment. Their comeback win at the Etihad delayed City's title celebrations in reality, but once City disappear from the dataset those three points disappear too, allowing Tottenham to close almost the entire gap.
The Biggest Surprise Is at the Bottom
The title changes are the obvious story, but the most unexpected consequence appears much further down the 2010/11 table.
Blackpool actually finished 19th on 39 points, one point behind Birmingham and two behind Wolves. In a simple table with City's row removed, nothing changes about the identity of the bottom three. Birmingham, Blackpool and West Ham still occupy those places.
The picture changes only when the City fixtures are erased.
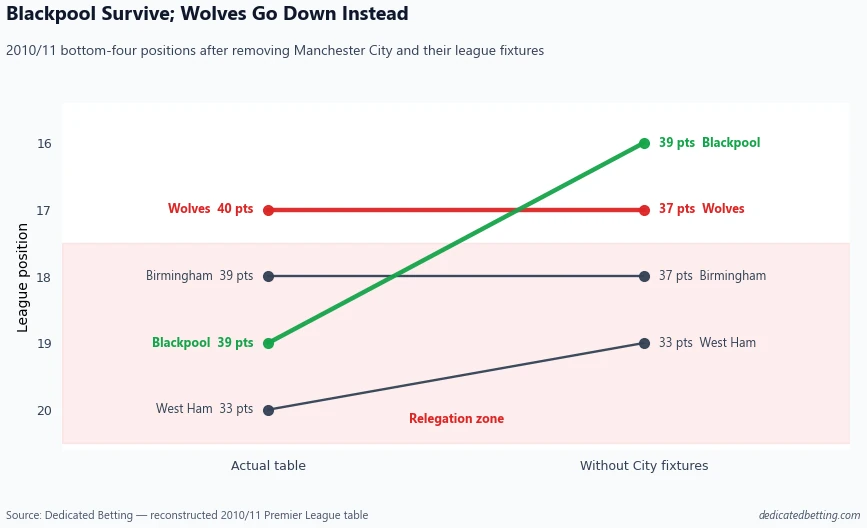
Blackpool lost both games against City, so their 39-point total is untouched. Wolves lose the three points they earned from City and fall from 40 to 37, while Birmingham lose two and also drop to 37.
The result is a complete reversal of Blackpool's fate. They rise from 19th to 16th, while Wolves fall into the reconstructed bottom three.
Across all nine seasons, this is the only case where removing City's matches changes which clubs occupy the bottom three rather than merely changing their order. It also captures the counterintuitive logic of the exercise better than almost any title race: sometimes losing twice to Manchester City is exactly what helps you once Manchester City no longer exists.
What Happens to the Top Four?
Given how often Manchester City finished near the top during this period, removing them naturally creates vacancies in the leading positions. Tottenham, Newcastle, Everton, Manchester United, Arsenal and Chelsea all benefit in different seasons simply because City's place disappears.
The more interesting test is what happens after the fixtures are removed as well.
Surprisingly, not one of the nine seasons produces another change in top-four membership. The order moves around, but the same four clubs remain inside the reconstructed top four.
There are still some notable reshuffles. Tottenham move above Arsenal in 2011/12, Arsenal move above Chelsea in 2013/14, and Arsenal also move above Liverpool in 2016/17. None of those changes, however, is large enough to pull a different club into the top four.
That is an important negative finding. Removing City's results creates plenty of movement elsewhere in the table, but it does not produce the wider collapse or reshaping of the Champions League places that might have been expected.
For historical accuracy, these are league-table top-four positions only. The analysis does not attempt to reconstruct the changing European qualification rules, cup routes or titleholder places that applied across the period.
Some Clubs Move Much More Than Others
The absence of a top-four membership shock does not mean the rest of the table stays stable.
Across the nine seasons, 59 team-season positions change once the City fixtures are removed from the 19-team table. Most of those moves are only one or two places, but a handful are much larger.
The biggest falls are four places. Aston Villa drop from eighth to 12th in 2010/11, Sunderland fall from ninth to 13th in the same season, and Norwich move from 10th to 14th in 2012/13. In each case, points earned against City disappear while nearby rivals lose less or nothing.
Bolton provide the clearest example in the other direction. They rise from 13th to 10th in 2010/11 despite losing no points themselves, because they had taken nothing from City. Clubs around them are weakened when their City results vanish, allowing Bolton to pass them without changing their own points total.
That is the mechanism behind most of the surprising movement. A strong record against City becomes a disadvantage in this particular counterfactual, while repeated defeats can leave a club relatively better off.
Who Had the Best Record Against Manchester City?
Looking at the clubs with the strongest records against City helps explain why some teams are hit harder than others.
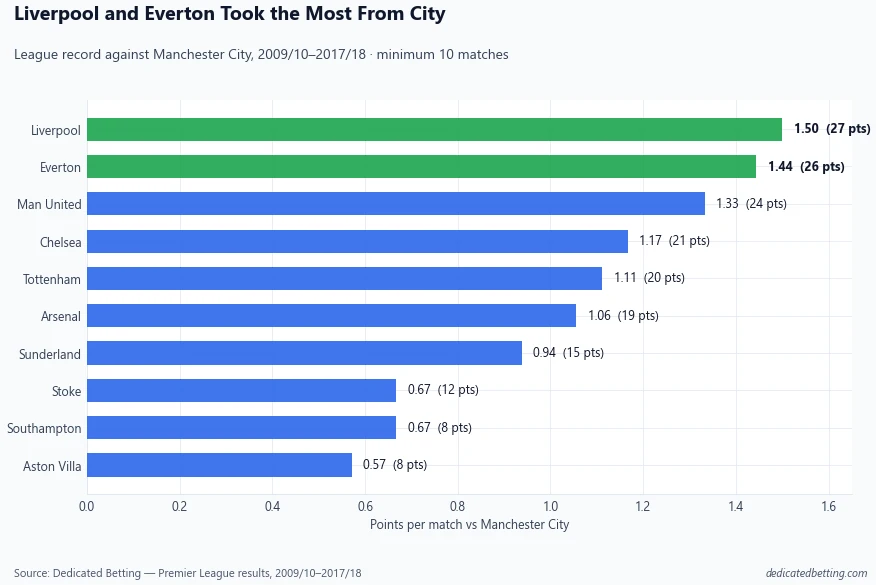
Across the full nine-season window, Liverpool collected more league points against Manchester City than any other club, but Everton were only one point behind and actually outperformed several of the traditional leading sides.
| Club | Matches vs City | Points | Points per game |
|---|---|---|---|
| Liverpool | 18 | 27 | 1.50 |
| Everton | 18 | 26 | 1.44 |
| Man United | 18 | 24 | 1.33 |
| Chelsea | 18 | 21 | 1.17 |
| Tottenham | 18 | 20 | 1.11 |
| Arsenal | 18 | 19 | 1.06 |
Liverpool's 27 points came from seven wins and six draws in 18 matches. Everton's total of 26 is perhaps the more surprising number, putting them ahead of Manchester United, Chelsea, Tottenham and Arsenal over the same nine-season window.
Those totals do not tell us which club was "hurt most" overall, because league position depends on what every nearby rival did as well. They do show which clubs had the most points available to lose when City fixtures disappear.
Removing City Does Not Always Make the League More Competitive
Another pattern emerges when we compare the title margins across all nine reconstructed seasons: removing the strongest club does not automatically make the race closer.
Chelsea are the clearest example. They won the real 2009/10 title by one point over Manchester United, but they had lost both league matches against City. Their total therefore stays at 86 when those fixtures disappear, while United lose the six points they earned from two Manchester derby wins. Chelsea's reconstructed margin grows from one point to seven.
A similar effect appears in 2014/15, when Chelsea's real eight-point advantage becomes 14 points without City. Leicester's 2015/16 margin, meanwhile, remains unchanged at 10 because both Leicester and Arsenal lose four points from their City fixtures.
Then there is 2017/18, where the opposite happens and a 19-point City title turns into a one-point United win over Tottenham.
The direction of the change therefore depends much less on City's final position than on how the contenders actually performed against them. The same deletion can widen one title race, barely affect another and turn a runaway season into a near dead heat.
What This Experiment Does Not Show
The exercise is intentionally simple, and that simplicity is also its main limitation.
These are not alternative histories in which Manchester City literally never existed. If City had not participated, schedules, transfers, finances, tactics and the strength of rival squads could all have changed. A 19-team Premier League might also have operated under different competition rules.
We have changed only one thing: Manchester City's league matches are removed from the historical results and the remaining tables are recalculated.
That makes the exercise transparent and reproducible, but it does not make it a prediction of what would really have happened. It is also unrelated to whatever sanction may ultimately result from the Premier League disciplinary process. Manchester City has appealed the Commission's findings, and the sanction stage remains separate.
How We Calculated the Alternative Tables
The analysis used Dedicated Betting's completed Premier League match data for all nine seasons from 2009/10 through 2017/18. Each season contained the full 380 completed league matches and 20 clubs before the counterfactual was applied.
Manchester City played 38 league matches in every season, giving 342 City fixtures across the nine-year window. For the main counterfactual, all 342 were removed, leaving the other 19 clubs with 36 matches each.
For every remaining club we recalculated:
- matches played
- wins, draws and defeats
- goals scored and conceded
- goal difference
- points
Teams were then ranked by points, goal difference and goals scored.
We also created a separate 19-team table in which City's row was deleted but every opponent retained the points and goals earned against them. Comparing that version with the full no-City table lets us distinguish the automatic effect of removing City's position from the genuine effect of deleting their fixtures.
The 19-team bottom three used in this article therefore means positions 17th to 19th in the reconstructed league. The analysis does not attempt to recreate historical European qualification routes, cup winners, transfer decisions or any wider consequence of Manchester City not participating.
So How Different Would Premier League History Look?
The simple answer is that three titles change hands: Manchester United gain two and Liverpool gain one.
The more interesting answer is that the same experiment produces very different effects from one season to the next. The 2011/12 title race disappears almost completely, with United winning by 20 points. Six years later, City's 100-point season turns into a one-point race between United and Tottenham. In 2010/11, Blackpool move out of the bottom three while Wolves fall into it.
At the same time, some of the expected chaos never appears. Removing City's fixtures does not create a single additional top-four membership change across the nine seasons.
That mixture is what makes the exercise interesting. The biggest historical headlines change exactly where expected, but many of the details do not.
Final thought: Removing one club from a league table is not really about removing one club. It also removes everybody else's results against them, and that is where the unexpected changes begin.
Data from the Dedicated Betting database: 3,420 completed Premier League matches across nine seasons from 2009/10 to 2017/18. The counterfactual removes Manchester City and all 342 of their league fixtures, leaving 19 clubs with 36 matches each. Tables are recalculated using points, goal difference and goals scored. This is a hypothetical statistical exercise, not a reconstruction or prediction of any Premier League sanction.
Related articles
Are football accumulators worth it?
Our 24‑season test of the five‑bankers strategy — including the strike‑rate drop, the one‑leg‑short pattern and the −18.43% ROI — is in our football accumulators article.
Why is picking the winner the wrong question?
Our analysis of why “who will win?” is the wrong question explains why prediction accuracy and betting profitability are not the same thing.
Do staking systems fix a losing approach?
Why Martingale, Fibonacci and percentage staking cannot turn a negative expected value into profit, tested with real historical parameters: Football Betting Systems.