
Five strong favourites. One small stake. A much larger potential payout.
Football accumulators are easy to understand and difficult to resist. Celtic, Barcelona, Benfica and two more apparent bankers may all look likely to win. Put them together and an unexciting collection of short prices suddenly offers an attractive return.
But how often does that five-team accumulator actually win, and what happens over a full season?
We tested the idea using league matches from 22 European divisions across 24 seasons, from 2002/03 to 2025/26. On each qualifying date, we ranked every team by its recorded win odds and built accumulators from the shortest-priced selections.
The main test produced 4,867 five-leg accumulators. Only 840 won, a strike rate of 17.26%. Betting one unit on every accumulator lost 896.8 units, an ROI of −18.43%.
Key finding: Five apparent bankers won together only about once in every six attempts. The strategy lost money in 19 of the 24 seasons tested, including one sequence of 44 consecutive losing accumulators.
Why Do Accumulators Look So Appealing?
Each individual selection may appear sensible. A team at odds of 1.30 is expected to win much more often than it loses. Add several teams at similar prices and the potential payout rises quickly.
For example, five selections priced at 1.40 produce combined decimal odds of approximately 5.38:
1.40 × 1.40 × 1.40 × 1.40 × 1.40 = 5.38
A £10 stake could therefore return approximately £53.80, including the stake. Every team can be a favourite and the accumulator can still be unlikely to win, because all five results must be correct.
If each selection independently had a 70% chance of winning, the chance of all five winning would be:
70% × 70% × 70% × 70% × 70% = 16.8%
That is the basic tension within an accumulator. Each leg can look likely in isolation while the complete bet remains more likely to lose than win.
How We Built the Bankers Strategy
For every completed league fixture with valid recorded home, draw and away bookmaker odds, we selected the shorter-priced of the home and away teams. We then grouped fixtures by date and ranked those selections from shortest to longest odds.
The shortest-priced team became banker one, the next shortest banker two, and so on. We tested accumulators containing the first 2, 3, 4, 5, 6 and 8 bankers. A date was included only when enough qualifying matches were available, and every selection on a card had to belong to the same season.
Each accumulator used a one-unit stake. Every leg had to win for the bet to return the product of its recorded decimal odds. A draw or defeat in any match lost the full stake.
This was a mechanical strategy. It did not use team names, league positions, recent form or personal judgement. It tested the familiar assumption that combining the day's strongest-looking favourites should produce a dependable bet.
What Happened as We Added More Bankers?
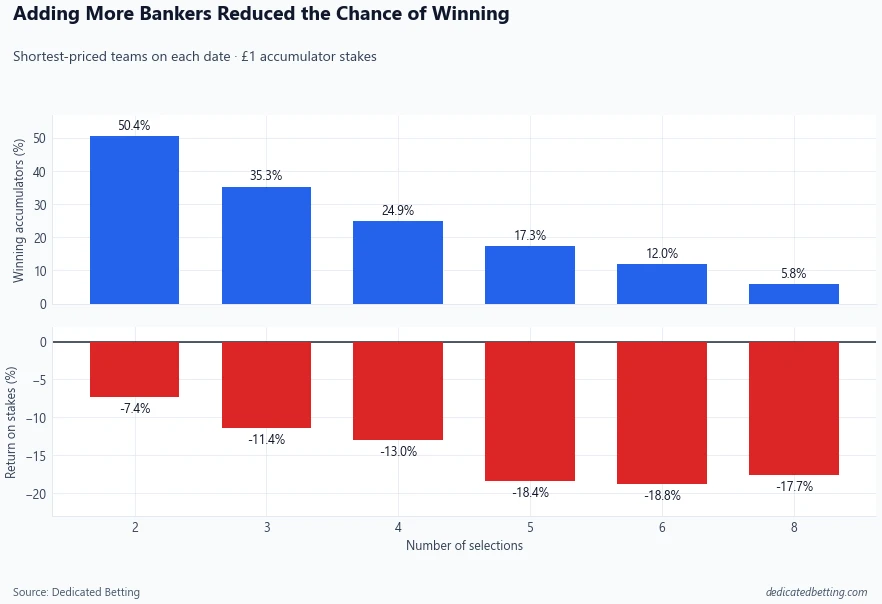
The chance of winning fell sharply with every extra selection.
| Selections | Accumulators | Winning accumulators | Median combined odds | ROI |
|---|---|---|---|---|
| 2 | 5,722 | 50.44% | 1.86 | −7.35% |
| 3 | 5,388 | 35.28% | 2.80 | −11.41% |
| 4 | 5,117 | 24.90% | 4.35 | −13.03% |
| 5 | 4,867 | 17.26% | 6.86 | −18.43% |
| 6 | 4,625 | 11.96% | 10.85 | −18.82% |
| 8 | 4,203 | 5.81% | 27.69 | −17.71% |
The two-leg accumulator won just over half the time. By five selections, fewer than one in six won. The eight-leg version won only 5.81%, approximately once every 17 attempts.
Every version lost money. The eight-leg ROI was slightly less negative than the five and six-leg results, but that does not establish that eight selections were safer or better. Its 244 winning bets included payouts at much longer combined odds, so a small number of results could move the return substantially.
The accumulator groups also overlap. The five-leg card contains the same first four bankers as the four-leg card, then adds another selection. These are comparisons of how the same daily strategy changed as more legs were added, not independent betting systems.
Only 840 of the 4,867 five-leg accumulators won. A one-unit stake on every card returned −18.43%.
What Did a Typical Five-Leg Accumulator Look Like?
The median five-leg card had combined odds of 6.86. The average was much higher at 10.23, because a smaller number of dates produced unusually long-priced combinations. The median is a better description of the typical card.
Across all 4,867 cards:
-
840 won.
-
4,027 lost.
-
Total profit was −896.8 units.
-
ROI was −18.43%.
-
1,480 lost by exactly one selection.
The average break-even win rate for the individual cards was 18.89%, while the actual win rate was 17.26%. The size of the payout varied from one date to another, so profitability cannot be judged by comparing the overall strike rate with the median odds alone.
Were All Five Bankers Really Safe?
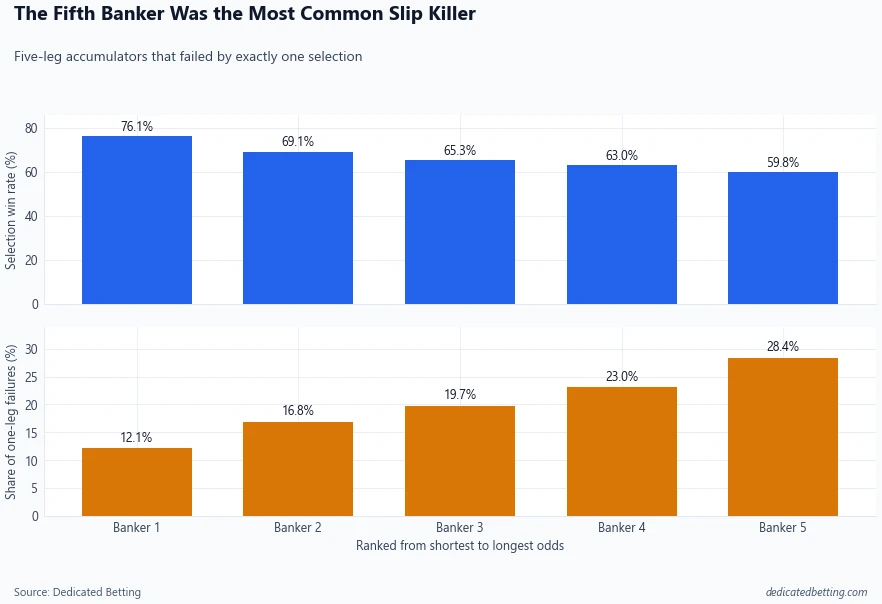
The word “banker” can make every selection sound equally dependable. They were not.
| Banker rank | Median odds | Selection win rate | Singles ROI | Share of one-leg failures |
|---|---|---|---|---|
| 1 | 1.25 | 76.06% | −3.26% | 12.09% |
| 2 | 1.36 | 69.10% | −4.57% | 16.82% |
| 3 | 1.50 | 65.26% | −4.12% | 19.66% |
| 4 | 1.57 | 63.04% | −2.21% | 23.04% |
| 5 | 1.65 | 59.77% | −3.10% | 28.38% |
Even the shortest-priced selection lost almost one match in four. The fifth banker won only 59.77%, which meant it failed more than two times in five.
Among accumulators that missed by one leg, banker five was the losing selection on 420 occasions. Bankers four and five together caused 51.42% of all one-leg-short failures.
This is not evidence that the fifth team was unusually bad. It was the longest-priced selection admitted to the five-leg card, so it was expected to be the least likely winner. Adding it increased the potential payout by an average price of 1.69, but also gave the complete accumulator another substantial opportunity to fail.
Why Does Losing by One Feel So Common?
The five-leg strategy lost by exactly one selection on 30.41% of all cards. Among the 4,027 losing accumulators, 36.75% were one leg short.
That creates a powerful impression of being close. Four correct predictions feel like evidence that the strategy worked and one team ruined it.
Mathematically, a four-from-five result has the same return as getting every selection wrong: the accumulator returns nothing. The fifth selection did not remove a profit that already existed. The bet was always conditional on all five teams winning.
The near miss can nevertheless encourage another attempt. A bettor may replace the team that lost, add a different banker and believe the next card has corrected the problem. Across thousands of bets, however, one-leg failures were a normal outcome of the structure rather than an unusual piece of bad luck.
One-leg-short finding: 1,480 five-leg accumulators missed by one selection. That was more common than a winning accumulator, which occurred 840 times.
What If the Same Teams Were Backed as Singles?
We also backed the exact same selections individually. For every five-leg date, that meant five separate one-unit bets rather than one unit on the accumulator.
| Selections used | Accumulator ROI | Same selections as singles ROI |
|---|---|---|
| 2 | −7.35% | −3.92% |
| 3 | −11.41% | −4.19% |
| 4 | −13.03% | −3.70% |
| 5 | −18.43% | −3.45% |
| 6 | −18.82% | −3.50% |
| 8 | −17.71% | −3.65% |
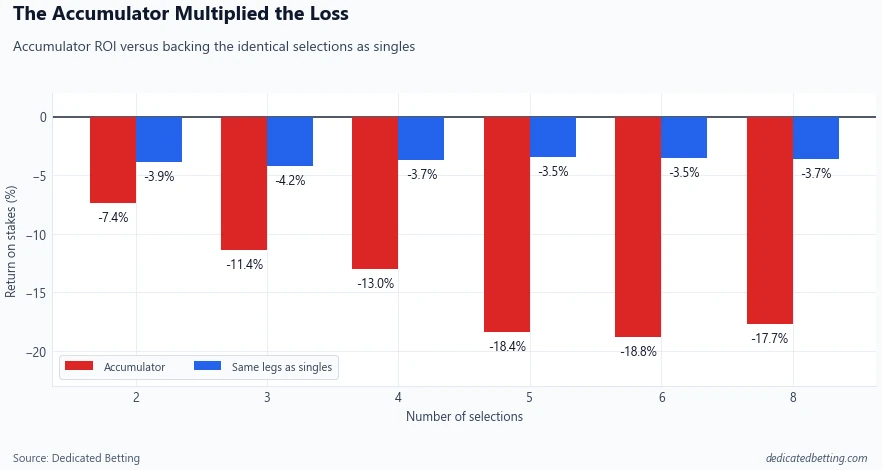
The five selections lost 3.45% of stakes when backed as singles. They lost 18.43% when tied together as an accumulator.
The raw profit totals require careful comparison because the staking was different. One unit on each of five singles risks five units per date, while the accumulator risks one. If the same single unit had instead been divided equally across the five teams, the historical loss would have been approximately 167.9 units, compared with 896.8 units from staking one unit on each accumulator.
Singles were not profitable. Every banker rank and every group of selections produced a negative singles ROI. The point is that the accumulator magnified the percentage loss by requiring every selection to win together.
How Does the Price Margin Compound?
An accumulator multiplies prices. It also multiplies any disadvantage already contained within those prices.
Our price-based market benchmark estimated an expected five-leg return of −29.84% after normalising the recorded home, draw and away odds for each match and combining the five selection probabilities. The actual five-leg return of −18.43% was better than that benchmark, but it was still a substantial loss.
This benchmark is not a claim that the normalised market probabilities were the true chances of each result. It shows how the margin within the recorded prices can build when several legs are combined.
A small disadvantage on one selection may not look important. Repeating it across every leg changes the economics of the complete bet. This is why an accumulator cannot be assessed only by looking at its attractive total odds or the apparent strength of its teams.
Could a Good Season Make the Strategy Look Successful?
Yes. The five-leg strategy made a profit in 5 of the 24 seasons tested. It lost in the other 19 seasons.
| Season result | Season | Accumulator ROI |
|---|---|---|
| Best season | 2023/24 | +20.79% |
| Second-best season | 2016/17 | +13.60% |
| Profitable season | 2020/21 | +8.64% |
| Profitable season | 2022/23 | +6.64% |
| Smallest profit | 2014/15 | +1.87% |
| Worst season | 2019/20 | −58.48% |
This variation helps explain why accumulators can feel more successful than their long-term record suggests. A few larger payouts can create a profitable run, and 2023/24 returned +20.79% across 214 cards. The next season lost 5.86%, followed by a 13.28% loss in 2025/26.
Strike rate did not determine the annual return by itself. In 2014/15, 22.22% of accumulators won and the season returned just +1.87%. In 2017/18, a similar 21.43% won, yet the strategy lost 10.82%. The combined odds of the winning cards also mattered.
The longest losing sequence occurred in 2021/22. Even though 37 accumulators won during the season, one run contained 44 straight failures.
At one bet per qualifying date, a 44-loss sequence would cost 44 units before another winner arrived. For someone using £10 as one unit, that is £440 lost during the run. Increasing stakes to recover earlier losses would expose the bankroll to even greater risk during precisely this type of sequence.
Do Accumulator Promotions Change the Result?
Our test used the recorded bookmaker odds only. It did not include enhanced prices, free bets, insurance when one leg loses, early payouts or other accumulator promotions.
Those offers can improve the terms of a particular bet. They do not turn the underlying selections into better predictions, and their conditions can differ substantially. Minimum odds, qualifying leg counts, maximum bonuses and withdrawal rules all affect the real value.
A promotion should therefore be evaluated separately. The relevant question is how much it changes the expected return after every condition, not how large the advertised boost appears.
Are Accumulators Ever Reasonable Bets?
An accumulator can be a form of entertainment with a known, limited cost. A small stake may provide an interest in several matches and the possibility of a larger return.
That is different from treating five favourites as a dependable way to build a bankroll.
Before placing one, consider:
-
Would every selection still look worthwhile as a single bet at its current odds?
-
How much does the final leg add to the payout, and how often is a selection at that price expected to lose?
-
Are you comfortable losing the entire stake if one team draws?
-
Is the stake fixed, or are previous losses influencing its size?
-
Are you judging the bet by its potential payout rather than the probability that every leg wins?
Removing a leg increases the chance of winning, but our results do not show that smaller accumulators were profitable. The two-leg strategy still lost 7.35% of stakes. Fewer selections reduced the historical loss without creating an automatic edge.
Our head to head pages allow individual fixtures to be assessed using current odds, model probabilities, team comparisons and market movement. Our league pages add wider form, home and away, scoring and market context. Those details are more useful for evaluating each price than simply searching for recognisable teams to complete a coupon.
How We Tested Football Accumulators
The analysis used completed fixtures from the Dedicated Betting league datasets across 22 European divisions from 2002/03 to 2025/26. Only the league data covered by the study was included.
For every match with valid recorded home, draw and away bookmaker odds, we selected whichever team had the shorter win price. Where the two team prices were equal, the home team was selected. Fixtures were grouped by calendar date and ranked by selection odds, with match ID used to resolve any remaining tie.
We built cards from the shortest 2, 3, 4, 5, 6 and 8 selections. A card was included only when all of its selections belonged to the same season. Each accumulator used a one-unit stake and returned the product of its recorded decimal odds only when every selection won.
The different accumulator sizes contain overlapping selections. They should not be treated as independent samples. Dates also contained matches from different leagues, reflecting the strategy of choosing the shortest-priced teams available across the competitions in the dataset rather than constructing a separate card for each league.
For the singles comparison, every selection was backed separately for one unit. Singles ROI divides profit by the total number of individual stakes. The equal-total-stake comparison divides one unit equally across all selections on the card.
The market benchmark converts the three recorded match prices into implied probabilities, normalises them to total 100%, and multiplies the relevant probabilities across the accumulator. It is a price-based reference and depends on the assumption used to combine those probabilities. It is not proof of the true probability or expected return of a future accumulator.
Recorded odds may differ from prices available to an individual bettor. Returns do not include promotions, cash-out decisions, stake restrictions or changes in price between recording and bet placement. Historical results do not establish future returns.
Final Verdict
The five-bankers accumulator was not a reliable route to profit in this dataset.
Only 17.26% of 4,867 five-leg cards won. The strategy lost 18.43% of stakes, finished in the red in 19 of 24 seasons, and experienced a run of 44 consecutive losses.
The teams were genuinely more likely to win than their opponents. Banker one won 76.06% of its matches and even banker five won 59.77%. That was not enough. Every selection had to win on the same card, and the prices did not compensate for all the ways the accumulator could fail.
Backing the same teams as singles also lost money, but the percentage loss was far smaller. Combining short-priced teams increased the potential payout and magnified the disadvantage already present in the selections.
Final thought: Five likely winners do not create one likely winning bet. An accumulator should be judged by the combined probability and price, not by how safe each team looks on the coupon.
Data from the Dedicated Betting database: completed league fixtures across 22 European divisions over 24 seasons, 2002/03 to 2025/26. The main result contains 4,867 five-leg accumulators after excluding cards whose fixtures belonged to different seasons. Returns use one-unit stakes at recorded bookmaker odds. Historical returns do not establish future profitability.
Related football articles
Why is picking the winner the wrong question?
Our analysis of why “who will win?” is the wrong question explains why prediction accuracy and betting profitability are not the same thing.
Is betting against the bottom team profitable?
We tested another appealing shortcut across 22 leagues in Is Betting Against the Bottom Team Profitable?.
Can simple football betting strategies make money?
See the wider comparison of common approaches in Football Betting Strategy: What the Data Actually Shows.