The team at the bottom of the league looks like an obvious opponent to back. It has lost more ground than anyone else. Its confidence may be low. Surely betting on whichever team plays it each week should win often enough to make money?
We tested that idea across 22 leagues and 24 completed seasons, from 2002/03 to 2025/26. For our main test, both teams had to have played at least ten league matches before the fixture. That left 14,595 matches where one team was bottom before kickoff and recorded bookmaker odds were available.
Key finding: Backing the bottom team's opponent won 50.6% of matches, but lost 934.3 units, or 6.40% of stakes. Those wins were insufficient to overcome the losing bets at the recorded prices.
How Does the Strategy Work?
Before each league fixture, we reconstructed the table using results from earlier dates in that season. If one of the teams was in last place, the strategy placed a one-unit bet on its opponent to win.
For example, if Fulham were bottom before playing Coventry, the bet would be on Coventry. A Coventry win pays at the recorded win odds. A draw or a Fulham win loses the stake.
We required both teams to have played ten league matches so the test would not classify a team as the league's worst simply because of an opening-week result. This is the main version of the strategy throughout the article. We also tested starting after five, 15 and 20 matches.
The table was based on points, then goal difference, then goals scored. If teams were still level, the underlying ranking used team name as the final tiebreaker. We checked that this did not create the profitable English League Two result discussed below.
Did Betting Against the Bottom Team Make a Profit?
No. Across the 14,595 qualifying fixtures, the bottom team's opponent won 50.6%, drew 24.0% and lost 25.4%. The average odds on the opponent were 2.04.
Those wins produced a loss of 934.3 units from 14,595 one-unit stakes, an ROI of −6.40%. A £10 stake on every match would scale that historical loss to approximately £9,343, before any practical limits on getting the recorded prices.
Why did a strategy that won more than half its bets lose money? Many of the opponents were favourites. A winning bet at short odds earns relatively little; a draw or an upset loses the entire stake. Win rate alone cannot tell you whether a bet offers value.
For comparison, the margin built into the same three-way bookmaker odds corresponds to a return of −6.89% using our normalised-odds benchmark. The observed opponent return was around 0.49 percentage points better than that benchmark, but still firmly negative. This is a comparison with prices on the same fixtures, not evidence that the strategy would beat the market in future.
Return from backing the bottom team's opponent after both teams had played at least ten matches: 14,595 bets and 934.3 units lost.
Would Waiting Longer Improve the Result?
The table is more informative later in the season. Perhaps waiting until a team has spent longer at the bottom would make the strategy more effective.
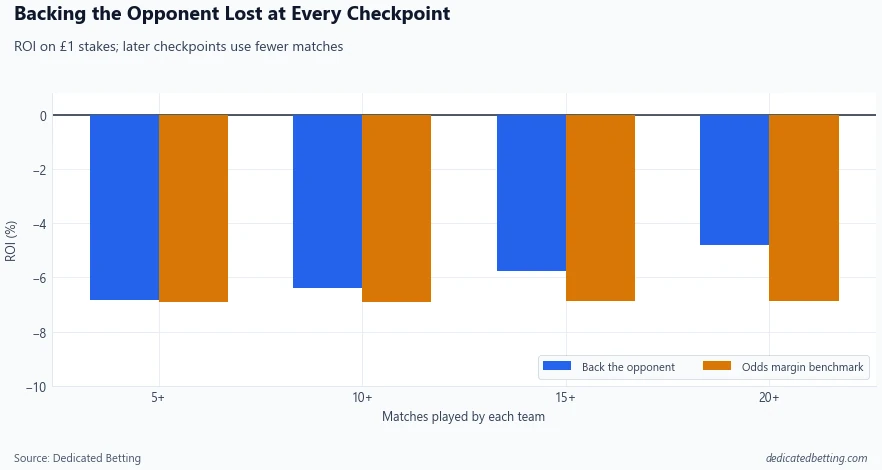
| Minimum matches played by both teams | Bets | Opponent wins | Opponent ROI |
|---|---|---|---|
| 5 | 17,363 | 49.8% | −6.83% |
| 10 | 14,595 | 50.6% | −6.40% |
| 15 | 11,894 | 51.4% | −5.75% |
| 20 | 9,179 | 52.2% | −4.80% |
The longer we waited, the more often the opponent won. Yet its average odds also shortened, from 2.07 after five matches to 2.01 after 20. At the 20-match checkpoint, the strategy still lost 440.6 units.
These are overlapping sets of fixtures, not four independent tests. The 20-match bets are also included in the five, ten and 15-match groups. The gradual improvement is interesting, but it does not identify a profitable point at which to switch the strategy on.
Does It Matter Whether the Bottom Team Plays at Home?
Home advantage gives this idea another obvious test. Opponents should win more often when the bottom team has to travel. Does that make them better bets?
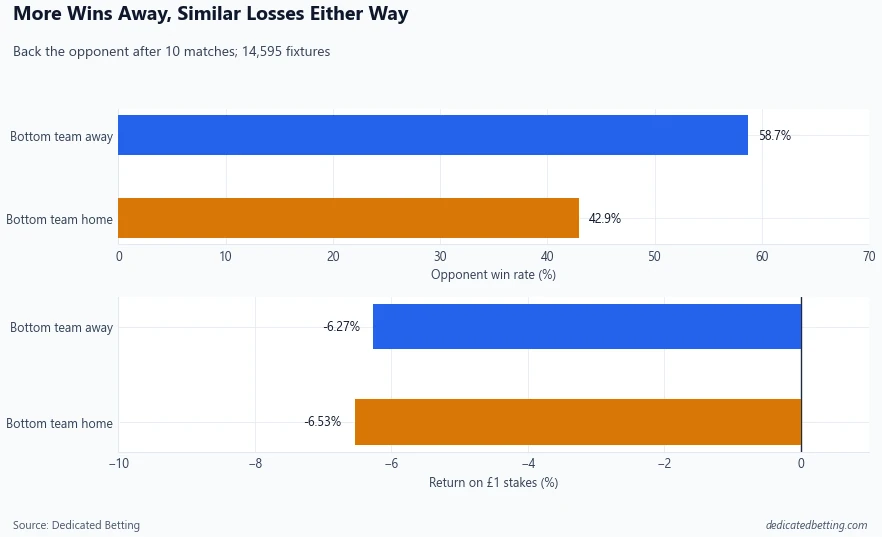
When the bottom team was away, its opponent won 58.7% of 7,123 matches. When the bottom team was at home, the opponent won only 42.9% of 7,472 matches.
The prices changed with those chances. Average opponent odds were 1.67 against an away bottom team and 2.40 against a home bottom team. The betting returns were almost identical: −6.27% and −6.53%, respectively.
What this means for bettors: Knowing that an opponent is more likely to win is useful, but the odds must offer enough compensation for the matches it does not win. Simply restricting this strategy to home favourites did not solve the problem.
What If You Backed the Bottom Team Instead?
There is a contrarian case for doing the opposite. The team in last place may be unpopular, and its odds may be long enough to reward the occasional upset.
Across the same 14,595 fixtures, bottom teams won 25.4% of their matches. Backing each of them returned −4.19%, or a loss of 611.8 units. That was a smaller loss than backing their opponents, but still a loss.
Bottom teams at home returned −3.22%; bottom teams away returned −5.21%. Neither venue was profitable across the full 22-league sample.
We also tested a bet that wins if the bottom team draws or loses. Using the recorded draw and opponent win prices, we calculated the equivalent return from splitting one unit between those two outcomes. This approach lost 8.24% of stakes at the ten-match checkpoint.
That calculation resembles the result of opposing the bottom team, but it is not an exchange lay-bet backtest. It uses bookmaker three-way odds, with their margin, and does not claim to reconstruct historical exchange lay prices or commission.
Did Any Leagues Beat the Overall Result?
Backing the bottom team's opponent lost in 21 of 22 leagues. The sole positive league was Ligue 2 (F2), returning just +0.32% across 667 bets, or 2.2 units. That result is close enough to break-even that it is a poor basis for recommending a league-specific system.
It was also unstable over time. In Ligue 2, the opponent strategy returned −9.01% over the first 12 seasons and +10.27% over the next 12. The full-period figure hides that reversal.
The more interesting league result appeared when we backed the bottom team. In English League Two, 867 such bets returned +81.7 units, an ROI of +9.42%. Another positive result, +8.03% in English League One, came entirely from its later period: League One returned −3.16% in 2002/03 to 2013/14, then +20.10% in 2014/15 to 2025/26.
League Two deserved a closer look because its bottom-team result was positive in both halves of the study: +11.50% in the first 12 seasons and +7.27% in the second.
These leagues were identified after comparing all 22 competitions and several versions of the strategy. A positive historical return in one subgroup is a reason to investigate, not a prevalidated betting edge.
Was the League Two Profit Spread Across Seasons?
It was not confined to one extraordinary year. Backing League Two bottom teams made money in 16 of the 24 individual seasons.
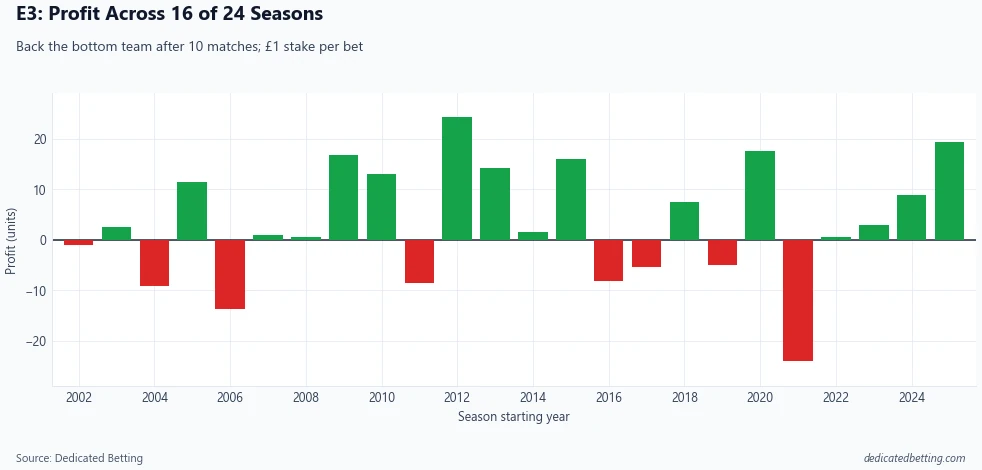
The best season, 2012/13, earned 24.2 units. The two strongest seasons together earned 43.5 units, more than half the full-period profit. There were substantial losses as well, including −24.1 units in 2021/22. Positive returns across both halves of the study did not mean a smooth or dependable run of results.
The venue split was particularly notable. Backing League Two bottom teams away returned +11.76% in the first 12 seasons and +11.97% in the next 12, a combined 51.8 units from 437 bets. Backing them at home also returned a profit in both halves, but fell from +11.24% to +2.57% in the later period.
There was one more question about the way we defined last place. If several teams had the same number of points, the team ranked bottom could depend on goal difference or another tiebreaker. In League Two, the result did not depend on those tied-on-points cases: when the team was clearly last on points, backing it returned +88.7 units across 744 bets, approximately +11.9% ROI. Matches where it was tied on points at the bottom lost 7.1 units across 123 bets.
That is a meaningful check on how we selected the English League Two matches. It still does not demonstrate that the same return would be available in a future season. We found the league by searching historical results, and annual returns were volatile.
What Should Bettors Do With the Bottom of the Table?
The league table is a useful starting point. A team last after ten matches has generally earned fewer points than its competitors. Our league table analysis also shows that standings become more informative as the season progresses.
But being able to identify the weaker team is different from finding a worthwhile bet. As our football betting strategy analysis found with other simple selection rules, the difficult question is whether the available price understates or overstates what is likely to happen.
Before backing either side, consider:
-
How far adrift is the bottom team on points, and how many games has it played?
-
Does its recent form look different from its season-long record?
-
Is the opponent strong enough to justify its short price?
-
Are injuries, suspensions or fixture congestion relevant to this match?
-
Has the price moved since opening, and what would have to happen for the current odds to be value?
Our league pages put the current table alongside team form and home and away context. Our head to head pages show upcoming fixture comparisons and odds movement. Those details can help investigate a particular match; the league position by itself is not a betting instruction.
How We Tested the Idea
We used league fixtures from 2002/03 to 2025/26 across 22 divisions. The main sample comprises 14,595 bets from fixtures where both teams had played at least ten prior league matches in the same season, exactly one participant was ranked last before that date, and valid recorded home, draw and away bookmaker odds were available.
We assessed one-unit stakes at the recorded decimal odds. ROI is total profit divided by the number of bets. A win returns the stake plus the quoted winnings; a draw or loss on a straight win bet loses one unit. For the draw-or-opponent calculation, we split the unit to produce the same gross payout for either winning outcome.
Our odds margin benchmark uses the three recorded home/draw/away prices for each fixture. We convert their implied probabilities into proportions that total 100%, then calculate the corresponding expected return at the quoted odds. It is a price-based reference, not a claim that those proportions were the true probabilities. A change in this benchmark over time reflects a change in the margin within these recorded prices; by itself, it does not show that bookmakers became better at predicting matches.
The reconstructed table uses points, goal difference and goals scored from earlier dates only. Matches on the fixture date are excluded from the pre-match ranking. Historical official tables can differ where points deductions, administrative decisions or competition-specific tiebreakers apply.
The returns describe historical bets at recorded prices. They do not include access restrictions, changes in quoted prices between recording and placement, or exchange lay commission. League, venue and season splits were examined after the overall test; apparent exceptions may reflect chance as well as genuine differences.
Final Verdict
Blindly betting against the bottom team was not profitable in this dataset. Opponents won more than half the time after the ten-match qualification, yet backing them lost 6.40% of stakes. Waiting longer, betting only when the bottom team was away, or covering the draw did not turn the overall approach into a winner.
Backing the bottom team also lost across all 22 leagues combined. The League Two profit is the most interesting exception: it appeared in both halves of the study and survived a check that removed cases tied on points at the bottom. Its year-to-year swings and the fact that we found it through a league-wide search matter just as much as its headline ROI.
Final thought: Last place can help describe a team. Only the odds, weighed against the specific match, can tell you whether backing or opposing it offers value.
Data from the Dedicated Betting database: league fixtures in 22 divisions over 24 completed seasons, 2002/03 to 2025/26. Main result: 14,595 qualifying matches after both teams had played at least ten league games. Returns use one-unit stakes at recorded bookmaker odds. English League Two and other league-specific findings were identified after comparing multiple leagues and strategies. Historical profits do not establish future profitability.
Related football articles
When does the football league table start to mean anything?
Our league table study tracks how quickly the standings become a reliable guide across 22 leagues.
Should you back a team after a heavy defeat?
We tested another appealing shortcut in Should You Back a Team After a Heavy Defeat?.
Can simple football betting strategies make money?
See the wider comparison of common approaches in Football Betting Strategy: What the Data Actually Shows.