
Football supporters are regularly told not to look at the league table too early.
After three matches, one good week can move a team from the bottom half into the top six. After five, promoted clubs can appear alongside title contenders and a difficult opening schedule can leave a strong team close to the relegation places.
The usual advice is to wait ten matches before taking the table seriously. But is ten actually the point when it becomes reliable, or is it simply a convenient round number?
We reconstructed the league table after every team had played the same number of matches, then compared each interim position with the final standings. The study covers 660 completed division-seasons, 12,129 team-seasons and 22 European leagues, using results from 1993/94 to 2025/26.
Key finding: The table starts becoming useful after around six matches, becomes a strong guide between 10 and 16 matches, and becomes highly reliable after approximately 24 to 26 matches. There is no single point when it suddenly becomes accurate.
What Does It Mean for a League Table to Be Reliable?
There are several ways to judge whether an early table means anything.
We measured:
-
How closely the order of teams matched the final table.
-
The average number of places each team moved before the end of the season.
-
How many teams finished within one, three or five places of their interim position.
-
How often the current leader became champion.
-
How quickly the top three and bottom three stabilised.
The main measure is the correlation between each interim table and the final standings. A correlation of 1.00 would mean the teams were already in their exact finishing order. A lower number means there is more movement still to come.
This is not a prediction model. It is a historical measure of how much information the table contained at each stage of the season.
When Does the League Table Become Meaningful?
The table contains some information almost immediately, but early positions remain highly unstable.
After one match, the correlation with the final standings was 0.365. That is not meaningless, partly because stronger teams are more likely to win even on the opening weekend. However, the average team still finished 5.23 places away from its position after that first match.
Reliability then increased steadily.
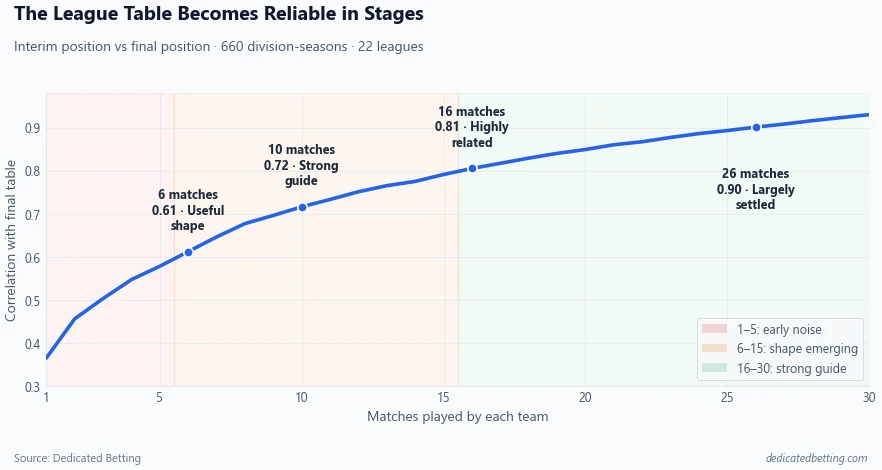
The major milestones were:
| Matches played | Correlation with final table | Average position error | Within 3 places | Within 5 places |
|---|---|---|---|---|
| 1 | 0.365 | 5.23 | 40.4% | 58.6% |
| 5 | 0.578 | 4.13 | 53.5% | 71.3% |
| 10 | 0.716 | 3.31 | 63.1% | 79.9% |
| 15 | 0.791 | 2.76 | 70.3% | 85.2% |
| 20 | 0.849 | 2.29 | 76.6% | 89.8% |
| 25 | 0.893 | 1.87 | 82.9% | 93.5% |
| 30 | 0.930 | 1.43 | 88.7% | 96.2% |
The progression gives us three useful stages.
Matches 1 to 5: early signal, substantial noise
The table is not random, but it is far too unstable to treat every position as a fair reflection of team strength.
After five matches, almost half of teams still finished more than three places away from their current position. Nearly three in ten finished more than five places away.
An impressive opening run matters, but five matches cannot tell us whether it came from lasting strength, favourable fixtures or ordinary short-term variation.
Matches 6 to 15: the broad shape emerges
After six matches, correlation passed 0.60 and the average error fell below four places for the first time.
The traditional ten-match rule has some support. At that point correlation reached 0.716, and four out of five teams eventually finished within five places of their current position.
That makes the ten-match table a useful guide. It does not make it settled. The average team still moved 3.31 places, and only 34.4% finished within one place of where they stood.
Matches 16 to 30: a strong guide, but not a final answer
Correlation first passed 0.80 after 16 matches. It reached 0.90 after 26.
The average position error fell below two places after 24 matches. By match 30, 88.7% of teams finished within three places and 96.2% finished within five.
Even then, only 65.4% finished within one place. The overall structure may be clear long before the exact order is decided.
The traditional checkpoint is useful, but not conclusive. The table had a 0.716 correlation with the final standings, while the average team still moved 3.31 places.
Does the Team Leading After Ten Matches Win the League?
This is where the table can be informative and misleading at the same time.
After ten matches, the eventual champion was usually already near the top:
-
77.4% of eventual champions were in the top three.
-
92.6% were in the top six.
But only 44.5% of the teams leading at that point went on to become champions.
In other words, the future champion was normally visible, but the current leader was still more likely not to win the league.
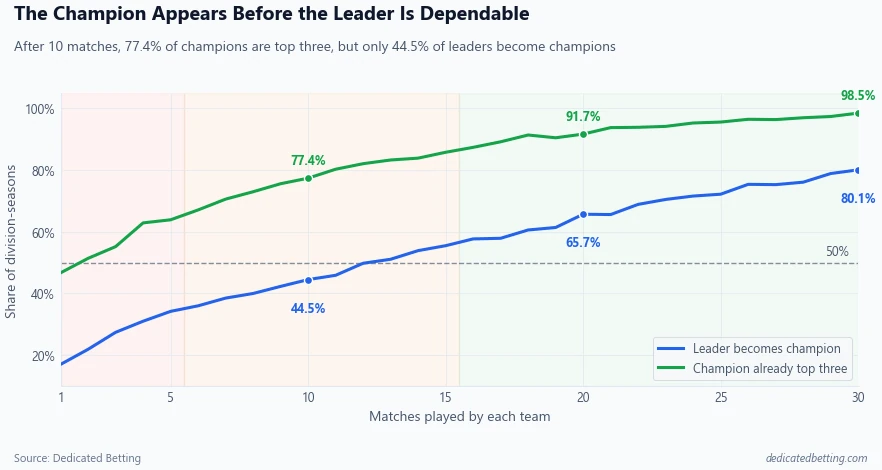
The current leader first became more likely than not to win the title after 13 matches. The historical championship rate then increased to:
-
55.5% after 15 matches.
-
65.7% after 20 matches.
-
72.2% after 25 matches.
-
80.1% after 30 matches.
Across the full study, there were 49 champions outside the top six after ten matches. That makes a recovery from further down the table possible, but unusual.
Title-race takeaway: Ten matches are usually enough to identify the main group of contenders. They are not enough to assume the team currently first will finish there.
Does the Top of the Table Settle Before the Bottom?
Yes. Top-three positions became more stable than bottom-three positions at almost every stage.
After ten matches, 61.3% of teams in the top three eventually finished there. Only 50.7% of teams in the bottom three remained in those positions.
The gap continued later into the season:
| Matches played | Top three remain | Bottom three remain |
|---|---|---|
| 5 | 51.3% | 40.6% |
| 10 | 61.3% | 50.7% |
| 15 | 69.5% | 58.3% |
| 20 | 76.4% | 66.0% |
| 25 | 81.2% | 71.7% |
| 30 | 86.2% | 79.5% |
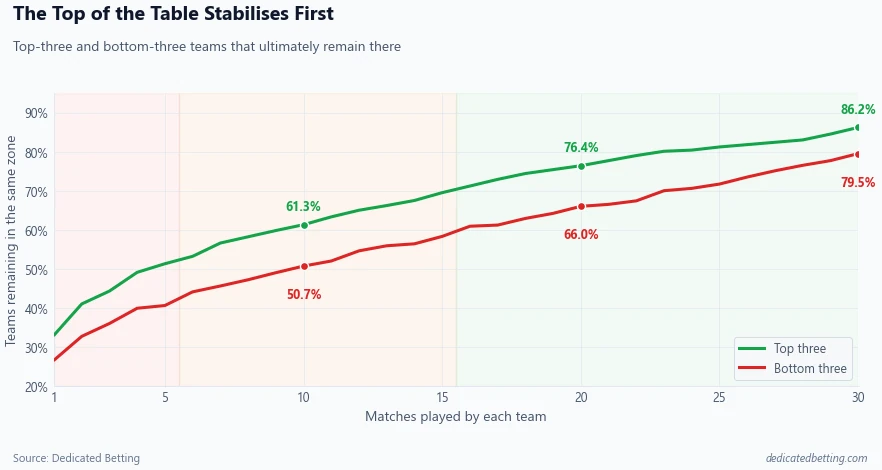
These are top-three and bottom-three comparisons, not exact promotion and relegation rates. League rules differ, particularly in divisions with playoffs or fewer relegation places.
The broader result is still useful. Strong teams tend to establish themselves near the top earlier, while the bottom remains more fluid for longer.
The data does not establish why. Possible explanations include smaller differences between weaker teams, mid-season improvement and the effect of managerial or squad changes. Those possibilities would require separate analysis.
Which League Tables Become Reliable Fastest?
The answer differs substantially between competitions.
After ten matches, the strongest relationship with the final table appeared in the Eredivisie at 0.802 and Serie A at 0.800.
The Premier League ranked joint third at 0.777, alongside the Greek Superleague. The Scottish Premiership followed at 0.776.
At the other end, the Championship recorded a correlation of 0.593. Scottish League One and League Two were also at 0.594, while La Liga 2 stood at 0.597.
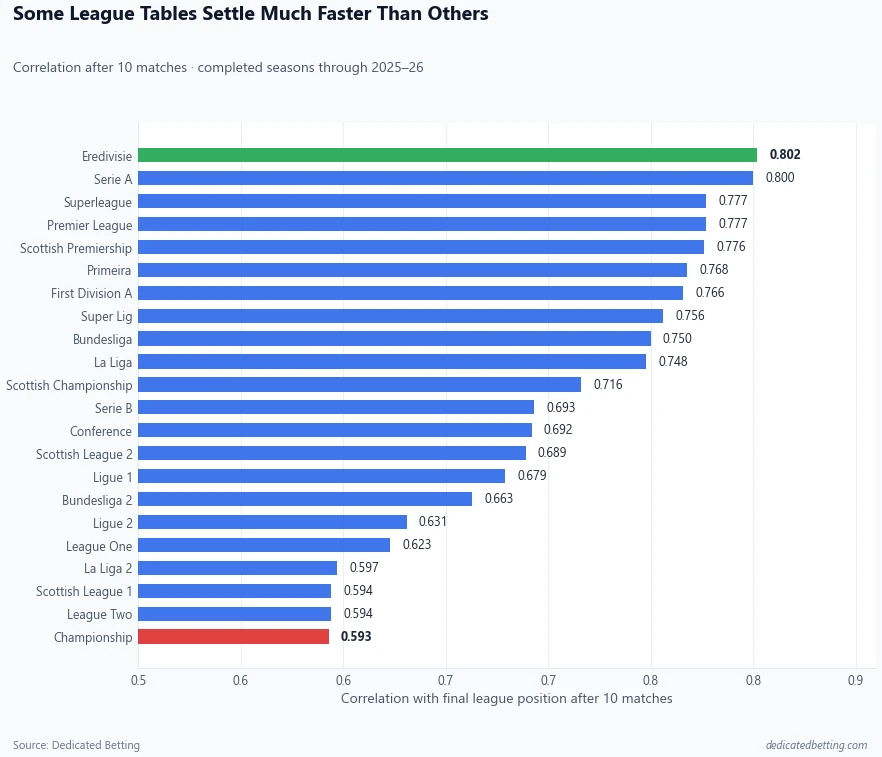
The comparison does not mean one competition is easy to predict and another is impossible. It measures how quickly the order of teams historically settled.
League size also matters when looking at raw position changes. Moving four places represents a much larger shift in a 10-team division than in a 24-team division. For this reason, the ranking uses correlation, while our supporting checks also measured errors as a proportion of the complete table.
The broad league pattern remained similar after accounting for table size.
League takeaway: A ten-match table has not carried the same amount of information in every competition. Applying one universal early-season rule ignores meaningful differences between leagues.
Have League Tables Become Reliable Earlier?
The most recent seasons produced slightly stronger early relationships than the oldest period in the study.
After ten matches:
| Era | Correlation | Average error as share of table |
|---|---|---|
| 1993/94 to 1999/2000 | 0.696 | 18.40% |
| 2000/01 to 2009/10 | 0.714 | 18.04% |
| 2010/11 to 2019/20 | 0.718 | 17.93% |
| 2020/21 to 2025/26 | 0.739 | 16.65% |
The current leader after 15 matches also became champion more often in the recent period, rising from 57.7% in 1993/94 to 1999/2000 to 65.3% from 2020/21 to 2025/26.
This is interesting, but it is not enough to conclude that modern leagues inherently settle faster. The group of competitions available in every era is not identical, and the most recent period contains only six completed seasons.
The safer conclusion is that the modern sample was somewhat more stable. Further league-controlled analysis would be needed to establish a genuine change over time.
What Does This Mean for Football Bettors?
An early league table is useful context, not a betting system.
The results show how much confidence to place in current position, but they do not show whether bookmakers have mispriced a team. By ten matches, the broad order contains considerable information. The betting market also has access to those results, team strength and league position.
The practical value is in avoiding two opposite mistakes.
Do not dismiss the early table completely
Even after three matches, the table had a measurable relationship with the final standings. Strong teams are more likely to rise early, and weak teams are more likely to struggle.
Saying the table means nothing until ten matches throws away real information.
Do not treat position as settled too soon
After ten matches, the average team still moved more than three places. Almost four in ten current top-three teams fell out, while almost half of current bottom-three teams escaped.
A team's position should be considered alongside:
-
The strength of its opening opponents.
-
Home and away fixture balance.
-
Goal difference and underlying performances.
-
Injuries, suspensions and squad changes.
-
How the current odds compare with the team's underlying strength.
Our league pages show current standings alongside home and away records, recent form, goals data and market-performance measures. For individual fixtures, the head to head pages add team comparisons, model information and current odds movement.
The table tells you where a team stands. It does not tell you whether the available price is good value.
How We Tested the League Table
The analysis used league results from 1993/94 through 2025/26.
For every division-season, we reconstructed the table after each team had played exactly the same number of matches. This avoids distortions from postponements, rearranged fixtures and games in hand.
Teams were ordered using:
- Points.
- Goal difference.
- Goals scored.
When teams were still exactly tied on all three measures, they received the average of the positions occupied by that tie. This avoids using an arbitrary alphabetical tiebreaker, particularly in the opening weeks.
We found 684 division-seasons within the period. Of those, 660 had equal final match totals for every team and were included. The remaining 24 were excluded because of shortened schedules, withdrawals, incomplete records or split-league structures with unequal match totals.
The included dataset contained:
-
22 leagues.
-
660 division-seasons.
-
12,129 team-seasons.
-
467,014 reconstructed team positions across different stages of the season.
The reconstructed standings may differ from some historical official tables because the data does not apply points deductions, administrative rulings or every competition-specific head-to-head tiebreaker. This limitation is unlikely to alter the broad progression, but it matters when interpreting individual historical examples.
Final Verdict
When does the football league table stop lying?
It starts telling a useful story after around six matches, but that story remains incomplete.
After ten matches, the table is a strong guide to the eventual order and usually contains the future champion somewhere near the top. It is still too early to trust the current leader, assume the bottom three are doomed or treat every position as a fair measure of team strength.
The table becomes much more dependable between 16 and 24 matches. By 26, its correlation with the final standings passes 0.90.
There is no magical week when uncertainty disappears. The table tells more of the truth with every round.
Final thought: Use ten matches to understand the shape of a season. Wait much longer before assuming that shape cannot change.
Data from the Dedicated Betting database: 660 completed division-seasons, 12,129 team-seasons and 22 European leagues from 1993/94 to 2025/26. Division-seasons with unequal team match totals were excluded. Positions were reconstructed from points, goal difference and goals scored. Historical patterns do not guarantee future results.
Related football articles
Which football leagues have the biggest home advantage?
Our home advantage league ranking compares all 22 competitions and shows how much the effect varies between leagues and over time.
Should you back a team after a heavy defeat?
We tested 24,688 cases to find out whether teams produce a profitable response after losing by three or more goals: Should You Back a Team After a Heavy Defeat?.
Do losing streaks create betting value?
Our losing streak analysis tests the contrarian theory across more than 370,000 team-match observations.